Deployment Guides
Docker Compose
Single VM, up to 100 developers
Kubernetes
Clustered, 100+ developers
Docker Compose Architecture
All services run as containers on a single Linux host, orchestrated by Docker Compose.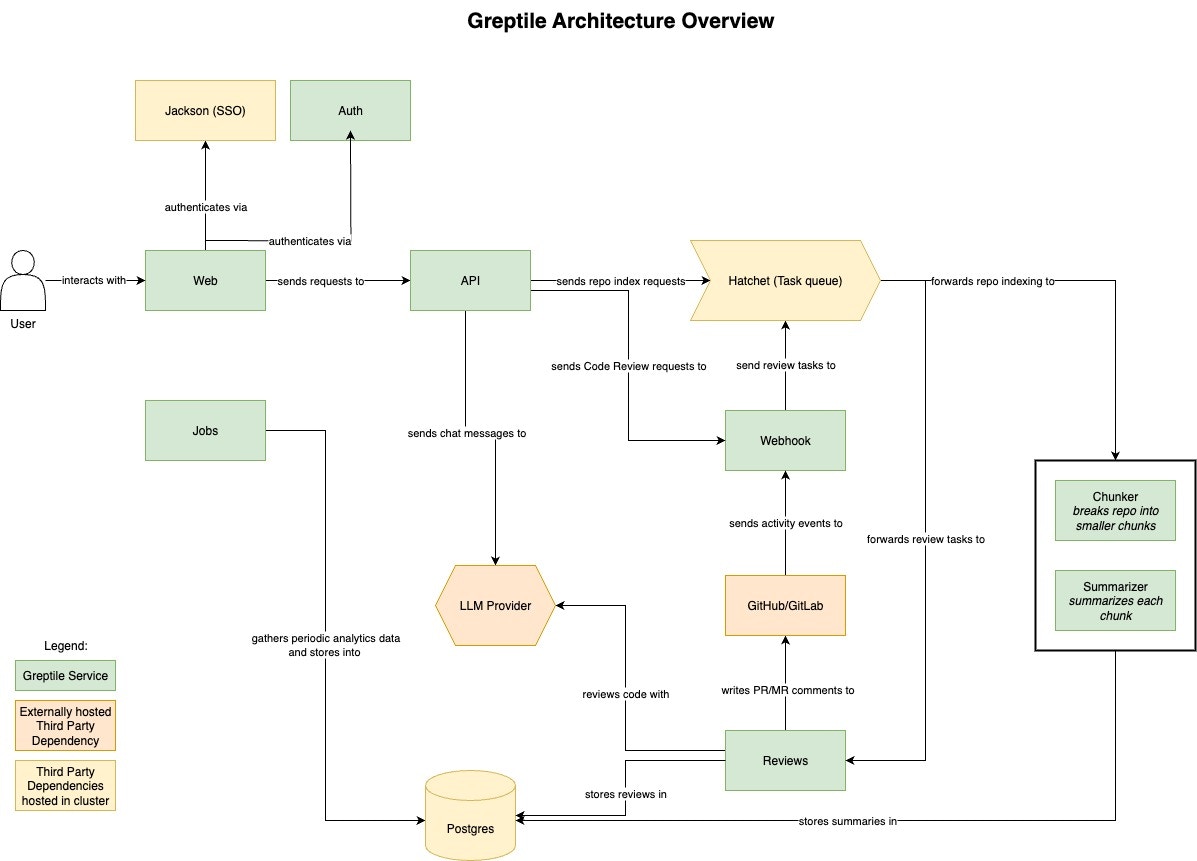
Core Services
| Service | Port | Function |
|---|---|---|
greptile-web | 3000 | Web UI |
greptile-api | 3001 | REST API, business logic |
greptile-auth | 3002 | Internal authentication |
greptile-webhook | 3007 | Receives GitHub/GitLab webhooks |
saml-jackson | 5225 | SAML SSO (Okta, Azure AD, etc.) |
Background Workers
| Service | Port | Function |
|---|---|---|
greptile-indexer-chunker | - | Splits repositories into chunks for indexing |
greptile-indexer-summarizer | - | Generates repository summaries |
greptile-reviews | 3005 | Generates PR reviews using LLMs |
greptile-jobs | 8086 | Scheduled tasks (analytics, cleanup) |
greptile-llmproxy | 4000 | Routes requests to configured LLM providers |
Infrastructure Services
| Service | Port | Function |
|---|---|---|
hatchet-api | 8080 | Workflow orchestration API |
hatchet-frontend | 8080 | Hatchet admin UI (via caddy) |
hatchet-engine | 7077 | Executes background workflows |
hatchet-postgres | - | Hatchet’s PostgreSQL database |
hatchet-rabbitmq | 5673 | Message queue for Hatchet |
greptile-postgres | 5432 | Application database (pgvector enabled) |
hatchet-caddy | 80/443/8080 | Reverse proxy for Hatchet |
Data Flow
- Webhook received →
greptile-webhookvalidates and queues the event - Hatchet picks up the job and dispatches to appropriate worker
- Workers (
chunker,summarizer,reviews) process viallmproxy - Results stored in PostgreSQL, response posted back to SCM
Network Requirements
Must expose:- Port
3007for SCM webhooks (or route through Caddy on 443) - Port
3000for web UI access - Port
8080for Hatchet admin (optional, can restrict to internal)
- LLM provider APIs (OpenAI, Anthropic, Bedrock, etc.)
- SCM provider APIs (GitHub, GitLab, etc.)
- Container registry for image pulls
Storage
PostgreSQL stores all application data including:- Repository metadata and summaries
- Code embeddings (via pgvector)
- Review history and analytics
- User accounts and settings
Kubernetes Architecture
Services deployed as pods across a Kubernetes cluster, managed by Helm charts. External PostgreSQL and Redis recommended for production.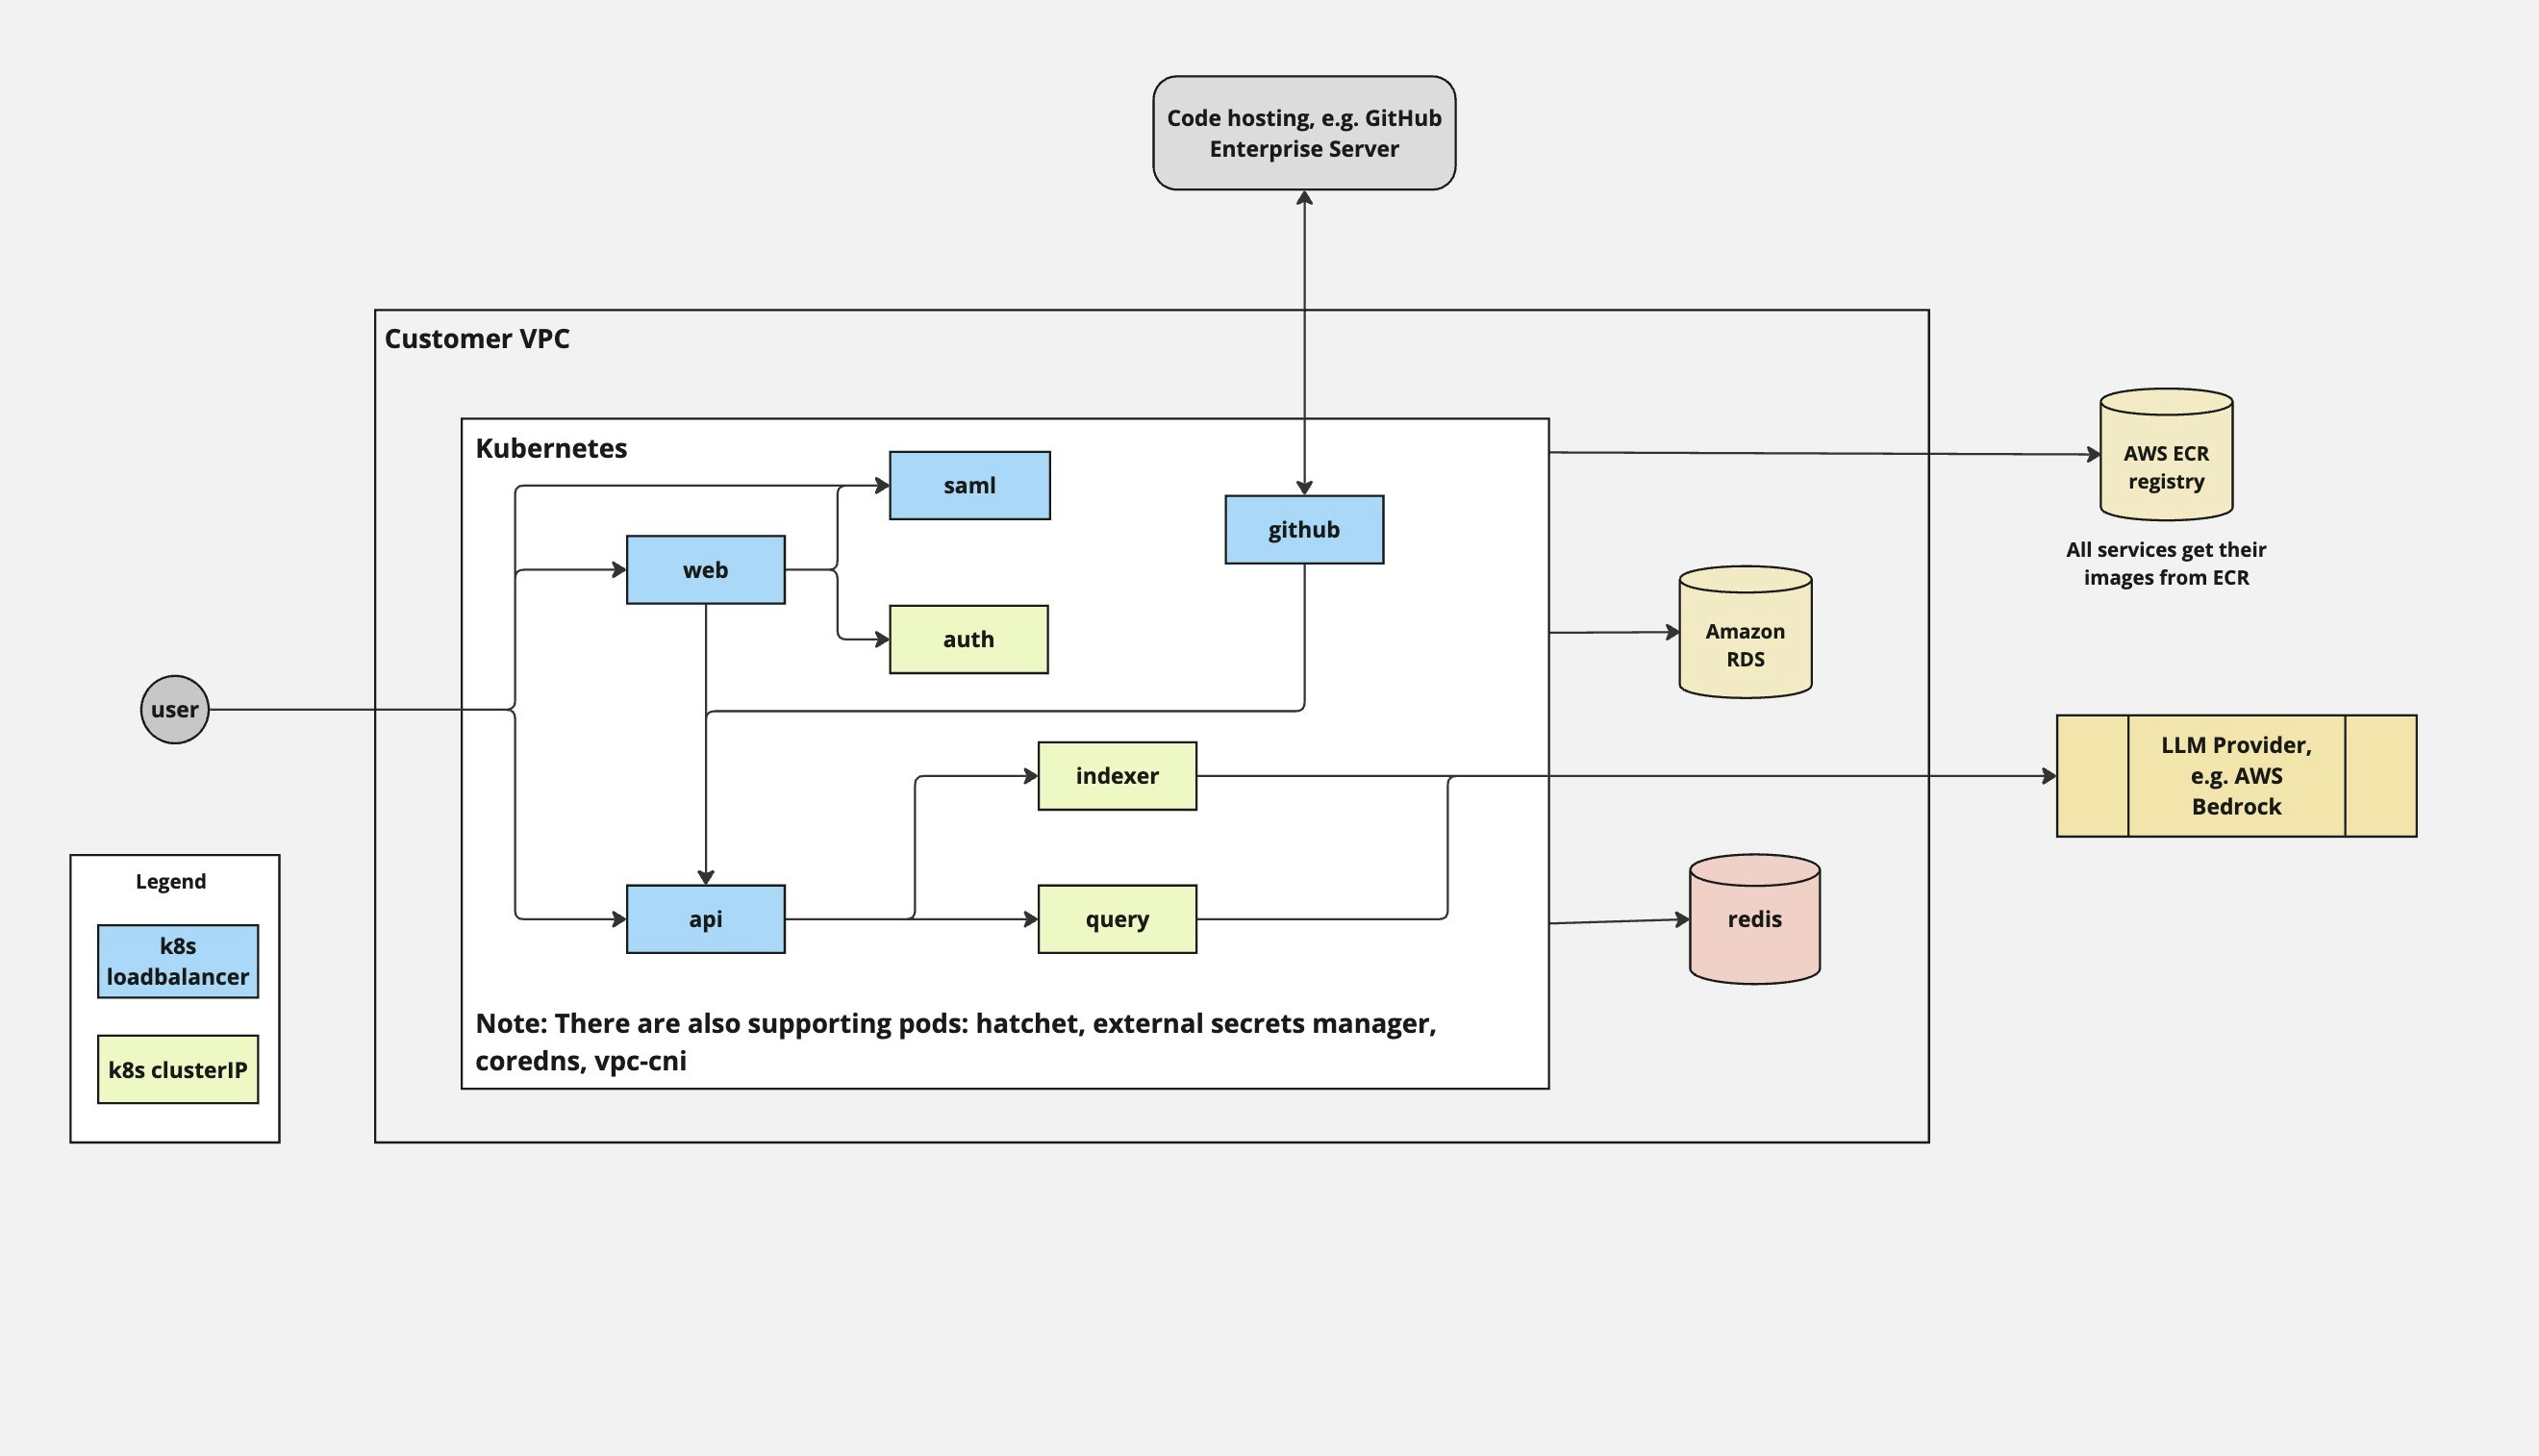
Pod Deployments
Same services as Docker Compose, deployed as separate Kubernetes Deployments:| Deployment | Replicas (prod) | Notes |
|---|---|---|
| web | 3 | Stateless, scales horizontally |
| api | 20 | High traffic, scales horizontally |
| auth | 1 | Low traffic |
| webhook | 5 | Scales with PR volume |
| chunker | 10 | CPU/memory intensive |
| summarizer | 50 | LLM-bound, scales with indexing load |
| reviews | 36 | LLM-bound, scales with review volume |
| jobs | 1 | Single instance |
External Services
Unlike Docker Compose, Kubernetes deployments typically use managed services:| Component | Recommended | Purpose |
|---|---|---|
| PostgreSQL | RDS with pgvector | Application data, embeddings |
| Redis | ElastiCache | Caching, rate limiting |
| Hatchet | Deployed via Helm | Workflow orchestration |
Networking
Ingress: LoadBalancer or Ingress controller exposes web and webhook services. Service mesh: Optional. mTLS between services if using Istio/Linkerd. Egress: NAT gateway for outbound traffic to LLM/SCM providers.Scaling Considerations
- API and Webhook scale with traffic volume
- Chunker scales with new repository indexing load
- Summarizer and Reviews scale with LLM throughput requirements
- Use HPA (Horizontal Pod Autoscaler) for dynamic scaling based on CPU/memory
Security Model
Authentication
| Method | Use Case |
|---|---|
| SAML SSO | Enterprise IdP (Okta, Azure AD, etc.) |
| Internal auth | Username/password for smaller deployments |
| GitHub/GitLab OAuth | Developer authentication |
Secrets Management
Docker Compose: Environment variables in.env file. For production, use a secrets manager and inject at runtime.
Kubernetes: External Secrets Operator syncing from AWS Secrets Manager, Vault, or similar.
Network Security
- Deploy in private subnet, expose only webhook port externally
- Database and Redis should not have public IPs
- Use security groups/firewall rules to restrict access
- All external traffic over TLS
Monitoring
Key Metrics
| What | Why |
|---|---|
| Hatchet dashboard | Workflow success/failure rates, queue depth |
| Container health | Restarts, OOM kills |
| CPU/Memory | Capacity planning, scaling triggers |
| Disk usage | Embedding storage growth |
| LLM latency | Provider performance |
Recommended Stack
- Logs: CloudWatch, ELK, or Loki
- Metrics: Prometheus + Grafana, or CloudWatch
- Alerting: PagerDuty, Opsgenie, or native cloud alerting